Learn more about CourseKata Data
Because CourseKata collects anonymized data on almost every click from students, we have a lot of different kinds of data available for researchers. These data fall into the three broad categories, namely motivation, engagement, and formative learning. Below, you’ll find an overview of CourseKata data.
Survey Data: Student Motivation, Attitudes, and Background Information
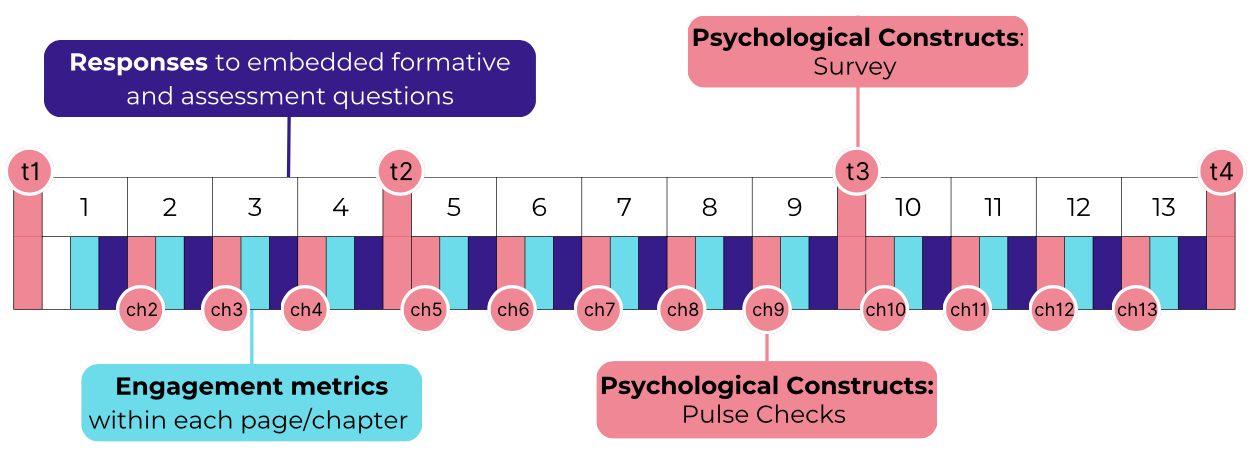
The embedded surveys include psychological constructs and student background information.
Psychological Constructs
Psychological constructs can provide context for understanding of students’ behaviors in the textbook. We measure students’ motivational (success expectancy, intrinsic value, utility value, perceptions of cost), and affective experiences (e.g., math anxiety), general attitudes and course perceptions, intentions (e.g., future interest in statistics), class belonging, beliefs about students’ math ability (i.e., mindset beliefs), as well as students’ perceptions of instructors (e.g., instructor beliefs and values).
Some of the psychological constructs are measured in our surveys during 4 timepoints (prior to chapter 1 in the pre-survey, after chapters 4 (mid1-survey) and 9 (mid2-survey), and at the end of the course (post-survey)), whereas some are only measured at the beginning and end of the course. Besides the surveys, we are also capturing students’ motivational experiences using pulse checks at the beginning of each chapter, starting at chapter.
For more information on the psychological constructs and its location in the textbook, see the latest overview and detailed overview of the survey structure.
Student Background Information
Student background refers to information about the students enrolled in the course. Examples of student background information include: age, race, ethnicity, gender, parental education, or major. This information is assessed at the beginning of the course in the pre-survey. Check out the detailed overview of the student background information to get a sense of what background information we collected. Examples of research conducted using student background information can be found in the Research Examples.
Engagement Data: Patterns of Student Interactions
On each page of the interactive textbook, we collect data on students’ engagement on that page (e.g., the time students were engaged in the material or the time students were on a page but not engaged). These engagement data are stored in three separate files: page_views.csv (this is the main one you may want to focus on), responses.csv, and media_views.csv. Examples of research conducted using engagement metrics can be found in the Research Examples.
Formative Learning Data: Insights into Student Progress
On almost every page of the interactive textbook, we collect data on students’ thinking and learning through their responses to embedded formative assessment questions in the textbook. These questions, broadly, take two forms: coding and non-coding questions.
The response data are organized into a table with a variable number of columns and a number of rows equivalent to the number of responses made to questions in the course. This table will likely be very large (200 students will yield around 300,000 responses). For more about what’s included in the responses file, see here for a description of each variable in the responses table.
End of Chapter Review questions
At the end of most chapters, students have the opportunity to complete a set of review activities to assess their knowledge and skills. The review activities consist of multiple choice questions, open-ended response items, and interactive R coding exercises that provide students with practice analyzing a new dataset. In the responses.csv file you’ll find these end of chapter review questions labeled as, for example “Learnosity: A2_Review1_01”.
Assessment blueprint
Are you curious about understanding how students learn statistics, the transfer of learning, or accuracy (such as click rates, identifying who is getting it right or wrong)? If you are, we invite you to explore this assessment-blueprint.csv (CSV, 424KB) sheet, which offers a comprehensive map of more than 1400 assessment items and objectives.
Within this sheet, you will find a detailed representation of what is taught in the course and where in the book you can find these concepts assessed. By utilizing this map, you can gain valuable insights into students’ learning progress, identify areas where transfer of learning occurs, and evaluate the accuracy of their comprehension. It serves as a valuable resource for educators and researchers alike who are interested in improving statistical education and enhancing students’ understanding in this subject.