Research Examples
Explore research examples using CourseKata data. From studies leveraging the psychological constructs or student background information, to engagement and formative learning data, these examples demonstrate the diverse and innovative applications and impactful outcomes enabled by CourseKata data.
Psychological Constructs
Utility Value, Behavioral Engagement, and Performance
Are you curious about how students’ perceived usefulness of course content (i.e., utility value) impacts their engagement and performance in introductory statistics? This study sheds light on how utility value interrelates with engagement and performance. This study found that utility value and behavioral engagement were related, and that both predicted final course grades. These findings emphasize the importance of understanding how to maintain high levels of utility value throughout the course of their studies.
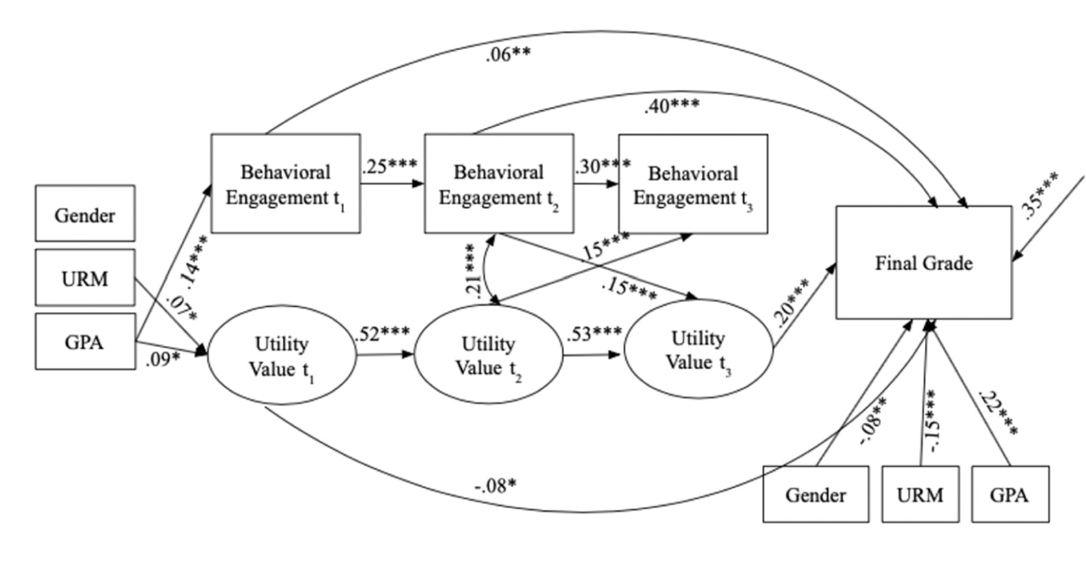
Click the following link to access the full study: Sutter, C.C, Hulleman, C. S., Givvin, K. B., & Tucker, M. (2022). Utility value trajectories and their relationship with behavioral engagement and performance in introductory statistics. Learning and Individual Differences, 93, 102095. https://doi.org/10.1016/j.lindif.2021.102095.
Pulse Checks
Dynamic and Situational Nature of Motivation
Motivation is dynamic and situational, meaning it can vary greatly as a function of the situation. To account for the situational nature of motivation, this study explored students’ success expectancy, utility value, and perceptions of cost ten times over a 10-week period. The results indicated that expectancies, intrinsic value, and utility value declined linearly while costs increased linearly over time.
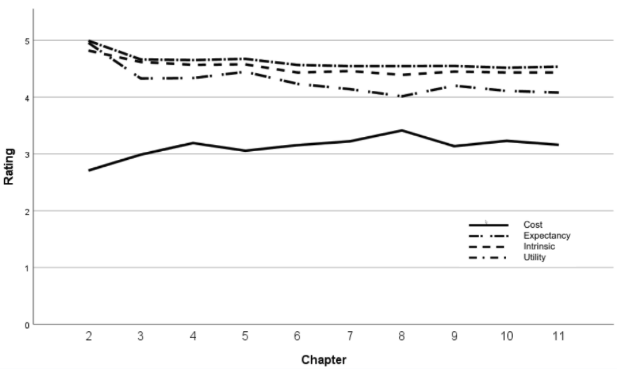
This study further found significant variability not only between students, but also within students, highlighting the importance of the interplay between individuals and their learning contexts. Importantly, the study highlighted that situational value had a stronger impact on performance for students from racially minoritized groups. These findings advance the understanding of motivational dynamics in statistics education and have implications for creating supportive learning environments.
This research is in progress. For a copy of a pre-print, please email claudia@coursekata.org
Student Background
Trajectories of Motivation by Gender and Race
This study sheds light on how the perceived usefulness of the course material (i.e., utility value) changes over the course of a term and how it varies by gender and race. The study found that, on average, utility value declined from the beginning to the middle of the course for all students, but for Black, Latinx, and other racially minoritized students this decline continued to the end of the course, whereas it did not for White and Asian. These findings emphasize the importance of understanding how to support students who identify with underrepresented groups in STEM.
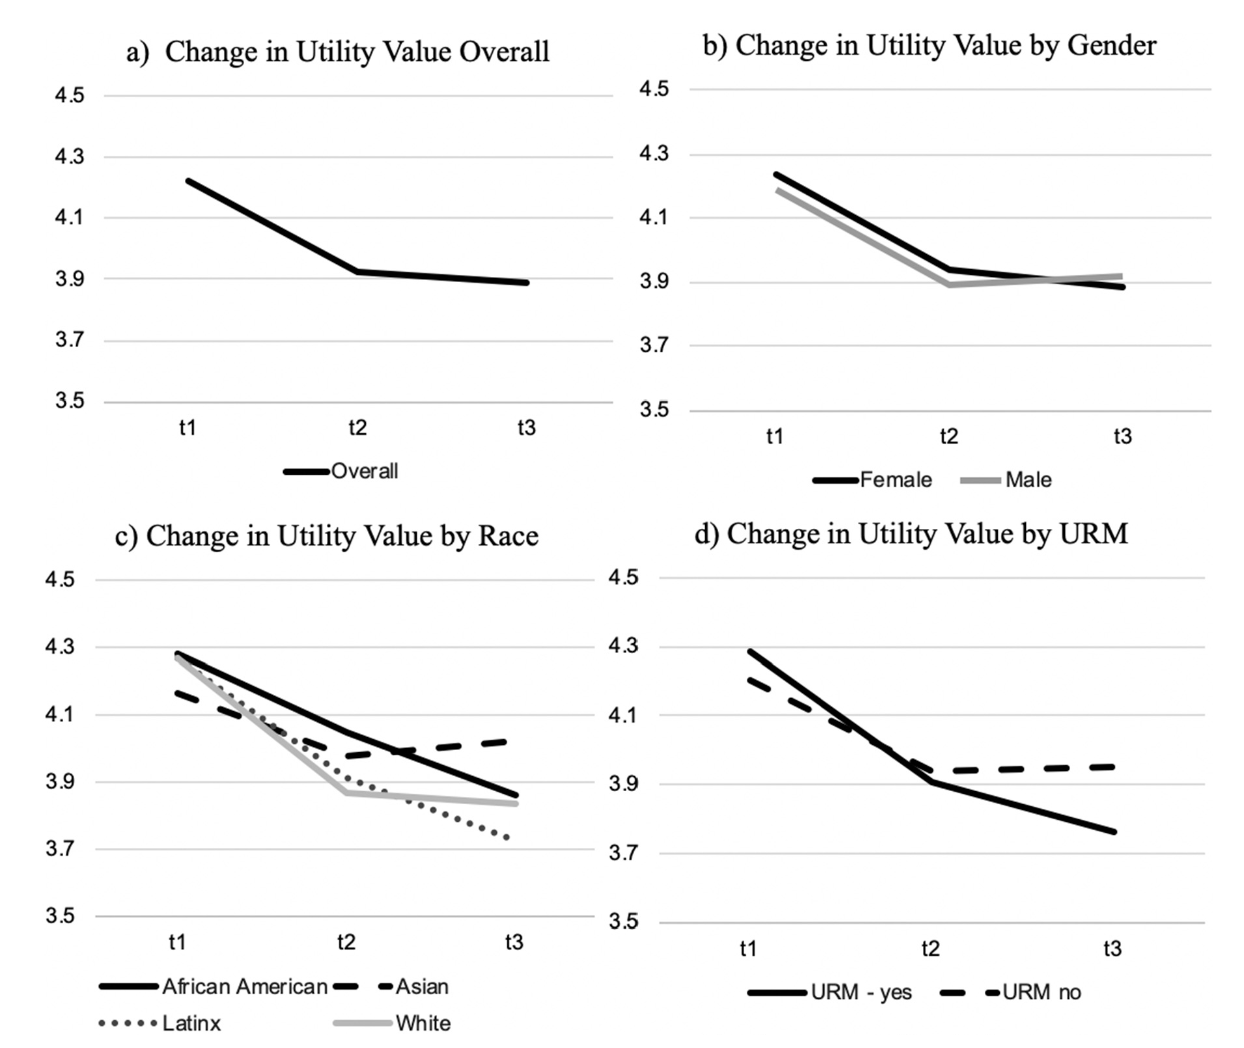
Click the following link to access the full study: Sutter, C.C, Hulleman, C. S., Givvin, K. B., & Tucker, M. (2022). Utility value trajectories and their relationship with behavioral engagement and performance in introductory statistics. Learning and Individual Differences, 93, 102095. https://doi.org/10.1016/j.lindif.2021.102095
Gender, Race, Programming Background
Are you interested in finding new ways to engage students in programming and statistics courses? This study introduces a novel approach to programming by developing an interactive online textbook that interleaves R programming activities with text to minimize the cognitive and emotional burden of learning programming. The study examined the attitudes and experiences of 672 undergraduate students as they used this online textbook during a 10-week introductory course in statistics. Despite initial negative attitudes and concerns related to R programming, most students developed more positive attitudes after engaging with the course materials, regardless of demographic characteristics or prior programming experience. In fact, the study found that change in attitudes toward R may be linked to students’ patterns of engagement over time and their perceptions of the learning environment. These findings suggest that incorporating interactive online textbooks into statistics courses could help to foster positive attitudes and engagement among students, ultimately leading to improved learning outcomes.
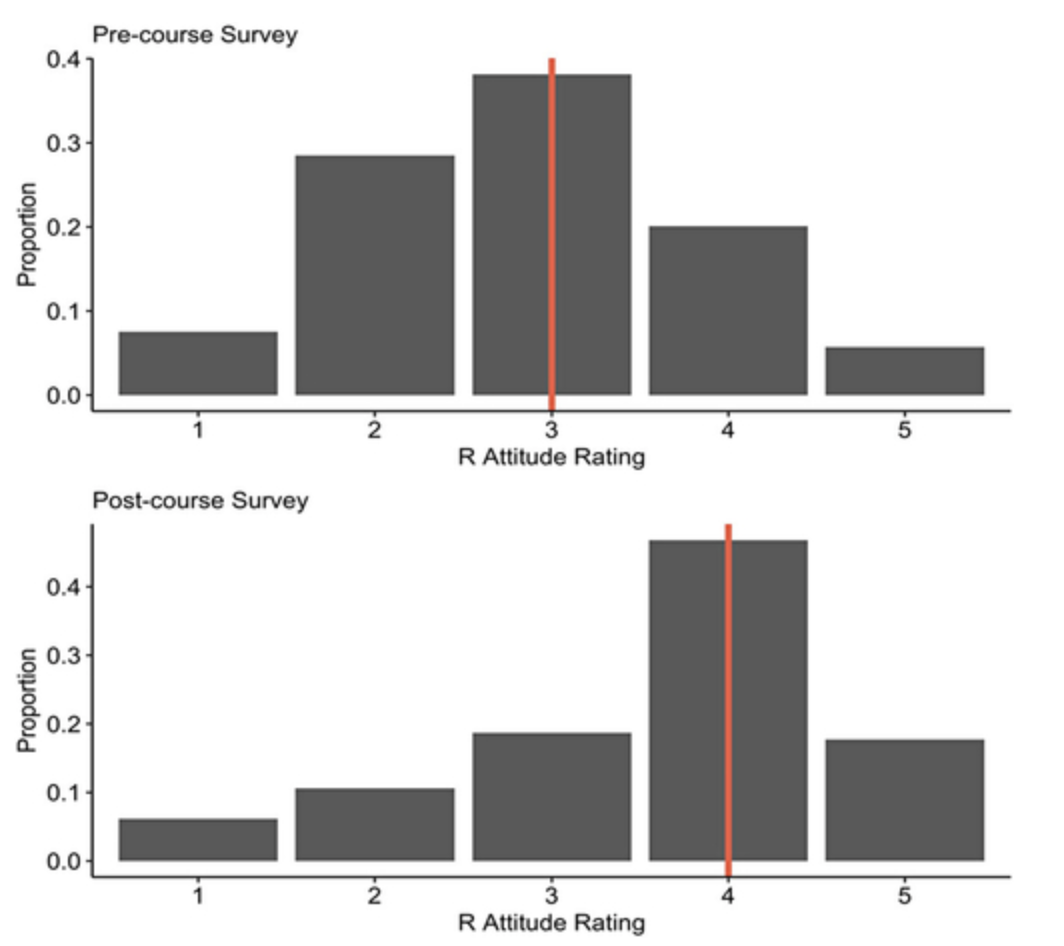
Click the following link to access the full study: Tucker, M. C., Shaw, S. T., Son, J. Y., & Stigler, J. W. (2022). Teaching Statistics and Data Analysis with R. Journal of Statistics and Data Science Education, 1-15. https://doi.org/10.1080/26939169.2022.2089410
Engagement Data
Using Effort and Engagement Measures to Support Learning and Teaching
Are you curious about how student engagement with course material affects their academic achievement? This study tracks the engagement of high- and low-achieving students in an introductory data science course with an online textbook. Using log data, the authors of this study created proxies for the level and type of effort students put into the coursework, and the level of frustration and struggling they experience throughout the semester. The findings revealed an increasingly divergent pattern of longer struggles and less effort from low-achieving learners, with a watershed week where this divergence becomes especially pronounced. The study concludes with discussions on how effort and struggling metrics could be used to support learning and teaching.
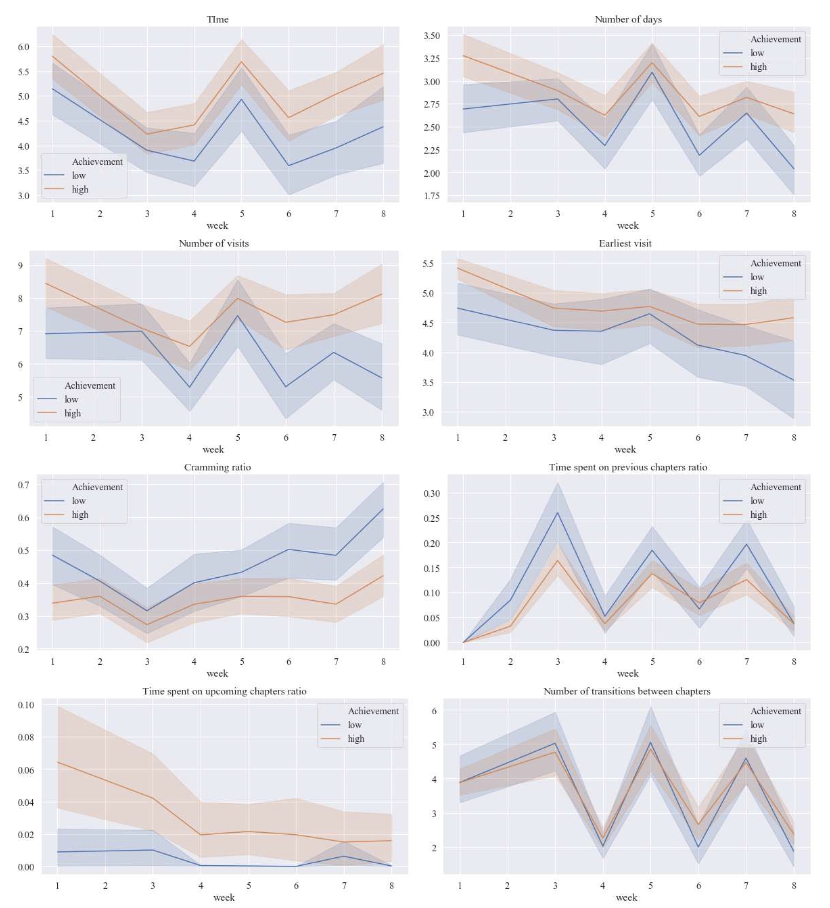
Click the following link to access the full study: Sung, G., Yang, S., Tucker, M, C., & Schneider, B. (2022). Effort and Struggles in the Data: How do Low and High Achieving Students Use an Online Textbook in an Introductory STEM Course? International Conference of the Learning Sciences.
Analyzing students’ reading patterns using K-means clustering
In this study, chapter-level features from behavioral measurements in each student’s engagement profile were extracted to measure the duration of student’s engagement with the textbook in quantifiable terms. To achieve the goal, the “traces” variable in the page_views.csv file was used. Using the information from the traces variable, their activity were organized into sessions. For each chapter of the textbook, the duration between the “off-page” timestamp and the next “engaged” timestamp was considered and a session as ending when this duration exceeded 10 minutes was defined. A session could comprise reading within one page or across multiple pages. Review quizzes at the end of most chapters were excluded from the reading session analysis as they were meant for performance assessment rather than formative evaluation.
Any session with a duration of less than one minute was removed, as learning may not occur during such a brief period. To ensure the validity of our filtering criteria, the timestamps of embedded questions on each page were compared with the duration of the sessions. There were hardly any embedded questions answered during a session of less than one minute.
K-means clustering is a commonly employed unsupervised machine learning approach within learning analytics (LA) for identifying data patterns (Bharara et al., 2018). It has proven to be useful in identifying learning patterns due to the heterogeneity of learners and the presence of similar learner characteristics that make it possible to achieve optimal outcomes.
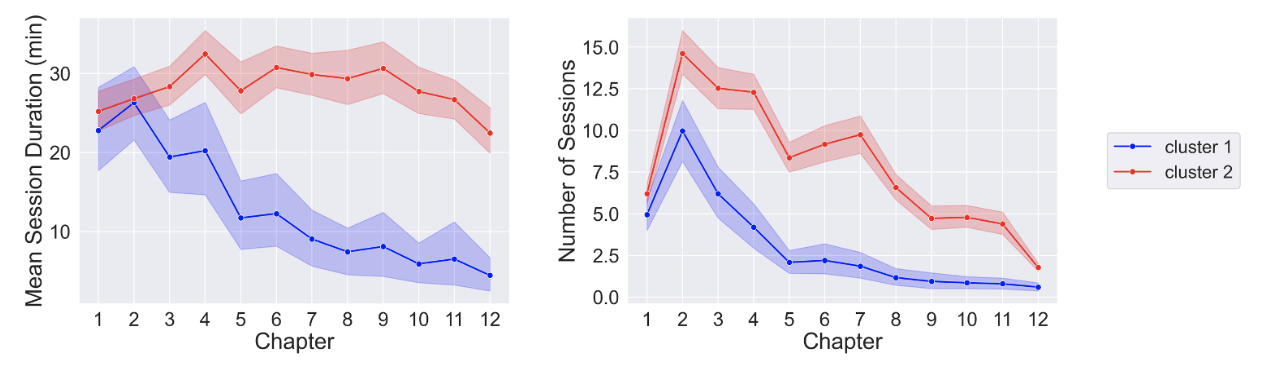
To test the predictive capability of session-related features, an exploratory K-means clustering analysis was performed using two features, n and d_mean. The model used 12 ns and 12 d_means as features for each student, corresponding to the 12 chapters present in the Coursekata textbook. Due to the limited sample size and the bimodal distribution of final course grades, the number of clusters K was arbitrarily set to 2.
The differences in the two clusters’ features produced by K-means clustering are evident in the figure below with students in cluster 2 dividing their reading into more sessions compared to those in cluster 1 (see left). Additionally, students in cluster 1 had a decreasing mean session duration as the course progressed, while cluster 2 students had a relatively consistent mean session duration (see right).
Authors: Alice Xu, Adam Blake, & Icy Zhang